Tijmen ter Beek

It’s always easier — and more cost-effective — to sell to existing customers than to acquire new ones. Existing customers already know your product or service and have gone through the buying process. But how do you uncover the exact value each customer represents? The answer lies in your transactional data.
What is the RFM Model?
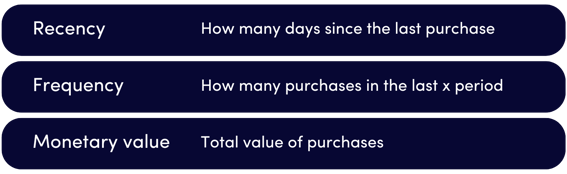
RFM stands for recency, frequency, and monetary value and is a way to segment buyers into different groups based on order history. RFM assigns values to how recently a customer made a purchase, how often they made a purchase, and how much money was involved.
How do you calculate RFM?
There are several ways to calculate an RFM score, from simple spreadsheets in Excel to built-in features in your CRM. However, the most efficient way is to use an existing RFM model built in Python or R.
Because the calculations can be complex, a data scientist can help you implement the model correctly and ensure it aligns with your organisation’s unified customer data. You provide the transactional data; the model returns clear segments you can use for targeted marketing.
In advanced Customer Data Platforms (CDPs) such as BlueConic, you can even link transactional data to customer profiles automatically and in real time. This makes customer segmentation faster and easier, and creates a single, unified view of the customer.
Results from RFM analyses
In an RFM analysis, each variable typically scores from 1 to 5. A customer who scores a 5 on all three dimensions is your best customer, while a customer who scores 1 on all three is least valuable.
Combining these scores can theoretically produce 125 (5×5×5) possible combinations — far too many to be actionable. Instead, you can reduce complexity by grouping scores into manageable segments. For example, you could:
-
Use an average RFM score to create “Gold,” “Silver” and “Bronze” tiers
-
Combine frequency and monetary value because they both indicate how much a customer buys
In the example below, 11 customer segments have been defined and each given a clear name for easy reference.
%202000%20x%201000%20px)%20(1).png?width=567&height=284&name=Aanpassingen%20MR%20(Team%20Data)%202000%20x%201000%20px)%20(1).png)
Visualising Your Customer Segments
To better understand how these segments relate to each other, you can plot them on a two-dimensional chart. In the example below, recency is on the x-axis and frequency / monetary value on the y-axis. Percentages show how many customers fall into each segment relative to the total.
Your best customers appear in the top-right quadrant, while those with the lowest scores are in the bottom-left. The goal is to move customers “up and to the right” with targeted marketing actions, for example, retention campaigns, cross-sell offers, or loyalty programs.

Taking the Next Step
By segmenting your customers with the RFM model, you’ve taken the first step toward data-driven marketing. In the next blog, we’ll explore how to act on these segments. What strategy works best for a “Champion” customer, and how do you re-engage an “About to Sleep” customer?


.png)